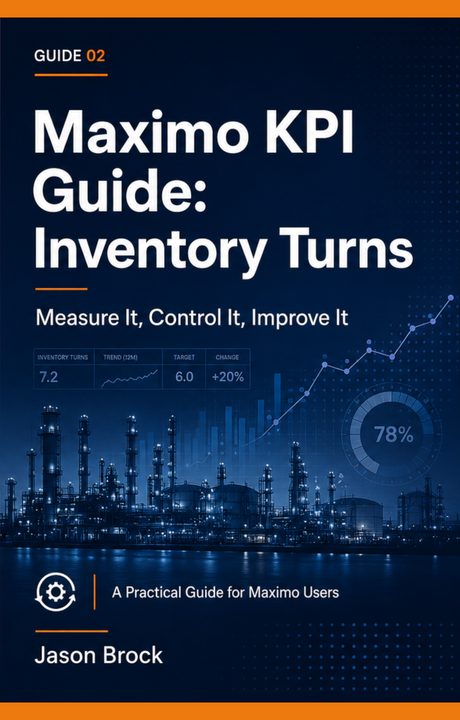
Maximo KPI Guide: Inventory Turns
Set it up in Maximo. Know what to do when it moves. Keep the data clean.
Most organizations measure Inventory Turns wrong. They run a query that only counts consumable issues and miss every rotating asset that moved through the storeroom. They include direct purchases in the numerator without a matching balance in the denominator. They lump insurance spares into the same target as fast-moving filters and then wonder why the number looks terrible. The formula is simple. Getting the Maximo configuration right is where it falls apart.
And the cost of getting it wrong is not academic. Finance looks at three million dollars sitting in the storeroom and asks why you have so much. If the only number you can produce is wrong, you end up defending inventory levels with anecdotes instead of data. Meanwhile every dollar on the shelf costs you 15 to 25 cents a year just to sit there, and you have no defensible way to say which of those dollars are working and which are dead.
Why the number is usually wrong
The breakdowns are specific, and they all live in the Maximo data model. Rotating assets do not get issued the way a box of filters does. When a pump leaves the storeroom it moves as a TRANSFER, not an ISSUE, so a query that only counts ISSUE transactions is blind to your entire rotating spares program. For a facility with real rotating inventory that undercounts the numerator by 20 to 40 percent.
The cost side has its own trap. AVGCOST shows up on the Inventory record, but it is not stored there. It is non-persistent and resolves from INVCOST at runtime, so a direct query that reads AVGCOST off INVENTORY comes back empty. You have to join INVCOST. Add direct purchases that never touched a storeroom inflating the numerator, ghost inventory inflating the denominator, and insurance spares dragging the aggregate down, and you get a number that looks reasonable enough that nobody questions it and wrong enough that you cannot trust it.
What the guide gives you
This is a complete operational control for Inventory Turns in IBM Maximo, not a definition and a bar chart. It starts with a locked definition so every site in your organization measures the same thing, then walks you through two calculation versions (aggregate and active-only), the rules for what counts and what gets excluded (including the distinction between consumable issues and rotating asset transfers), a segmented threshold framework with Green, Yellow, and Red bands for consumables, rotables, and insurance spares separately, and a trigger-action matrix with named owners, deadlines, and the specific evidence that has to exist in Maximo to prove the action was taken.
Chapter 6 is the implementation chapter. It includes a verified core objects and fields table covering MATUSETRANS, INVBALANCES, INVENTORY, INVCOST, ITEM, and ASSET. It walks through KPI Manager configuration step by step, including why the full ratio cannot live there and what to put on the Start Center instead. It covers Start Center portlets (a dead stock watchlist and a stockout risk companion view), Cognos Analytics report design with five dashboard components, and six annotated SQL queries you can run directly against your database, each with platform notes for DB2, Oracle, and SQL Server. Chapter 7 gives you six structured drilldowns for when turns drop below target, starting with ABC segmentation and dead stock analysis, and eight root cause playbooks that map each common failure pattern to the specific query that confirms it.
What the improvement is worth
Inventory Turns improvement is capital recovery. Every fractional gain in turns is money freed from the storeroom that can go somewhere else. The guide includes a full ROI framework with the inputs you already have. Here is the shape of it.
| Facility | Inventory value | Turns | Capital freed | Carrying cost saved |
|---|---|---|---|---|
| Small | $500K | 0.8 to 1.2 | ~$167K | ~$33K/year |
| Mid-size | $3M | 1.0 to 1.5 | ~$1M | ~$200K/year |
| Large (6 storerooms) | $15M | 0.7 to 1.2 | $5M to $6M | $1M to $1.2M/year |
The honest version: freed capital is reduced procurement spend realized over time, not a check someone writes you. Cut stock without improving planning and you buy stockouts, not savings. And insurance spares never get cut for turns. The guide walks through all three caveats so you can put real numbers in front of finance without overpromising. You can run these numbers against your own inventory with the free ROI calculator linked below.
Who this is for
This guide is for materials managers and storeroom supervisors who own the data, maintenance managers who have to report the metric, reliability engineers who need to act on it, Maximo administrators who configure it, and consultants who want a reference that goes past "divide issue value by average inventory value."
Not a 5-page PDF
This is not a 5-page PDF with a formula and a bar chart. It is a complete implementation guide with a 14-step quick setup checklist, a pseudo-filter logic reference card that translates every SQL query into plain logic, and a 27-term glossary. Hand the checklist to your Maximo admin and say "do this Monday morning."
This guide is part of the Maximo KPI Guide Series. Each guide follows the same 8-chapter structure so you can build a complete work management scorecard one KPI at a time.
Frequently asked questions
How do you calculate Inventory Turns in IBM Maximo?
Take the total value of materials issued over a rolling twelve months and divide it by the average on-hand inventory value. The numerator comes from MATUSETRANS.LINECOST for consumable issues plus rotating asset transfers, filtered to LINETYPE 'ITEM'. The denominator comes from INVBALANCES.CURBAL multiplied by AVGCOST, which you read from INVCOST, not the Inventory record.
Why does my Inventory Turns number look wrong?
Three common causes. Your query counts only ISSUE transactions and misses rotating assets, which move as TRANSFER and can be 20 to 40 percent of the numerator. Direct purchases that never entered a storeroom inflate the numerator with no matching balance. Or ghost inventory inflates the denominator, making turns look worse than reality.
What is a good Inventory Turns target for MRO?
Do not copy someone else's number. Baseline first. Most MRO operations land between 0.8 and 1.5 aggregate turns, and world-class active stock runs 2.0 to 3.0. Insurance spares are not measured by turns at all. They are measured by availability, so carve them out before you set a target.
Can Maximo KPI Manager calculate Inventory Turns?
Not directly. The full ratio needs multi-table joins, rolling date windows, and averaged monthly snapshots, which KPI Manager cannot do. Use Cognos or direct SQL for the ratio, and use KPI Manager for the Dead Stock Rate, the contributing signal that most directly drags turns down.
Get the guide and set it up this week.
Buy on Amazon